By Matthew Dubins – Founder of Donor Science Consulting
If you ever want a source of fundraising related news updates and thoughtful discussion, Fundraising Twitter is where to find it.
I recently came across a tweet casting doubt on whether GivingTuesday drives more donations from people. Could it be that GivingTuesday just changes the time frame and channel of existing donations?
I read this tweet and was instantly charged with the motivation to answer. To be clear, I’ve done a lot of in depth analytics for GivingTuesday through my business. Before I came along, there was already important work done that showed that GivingTuesday generates a net lift in aggregate donation results. In the work that I did, I looked at donor behaviour patterns in greater detail and I happened to remember a specific graph that I created that runs counter to the notion that GivingTuesday just moves money around.
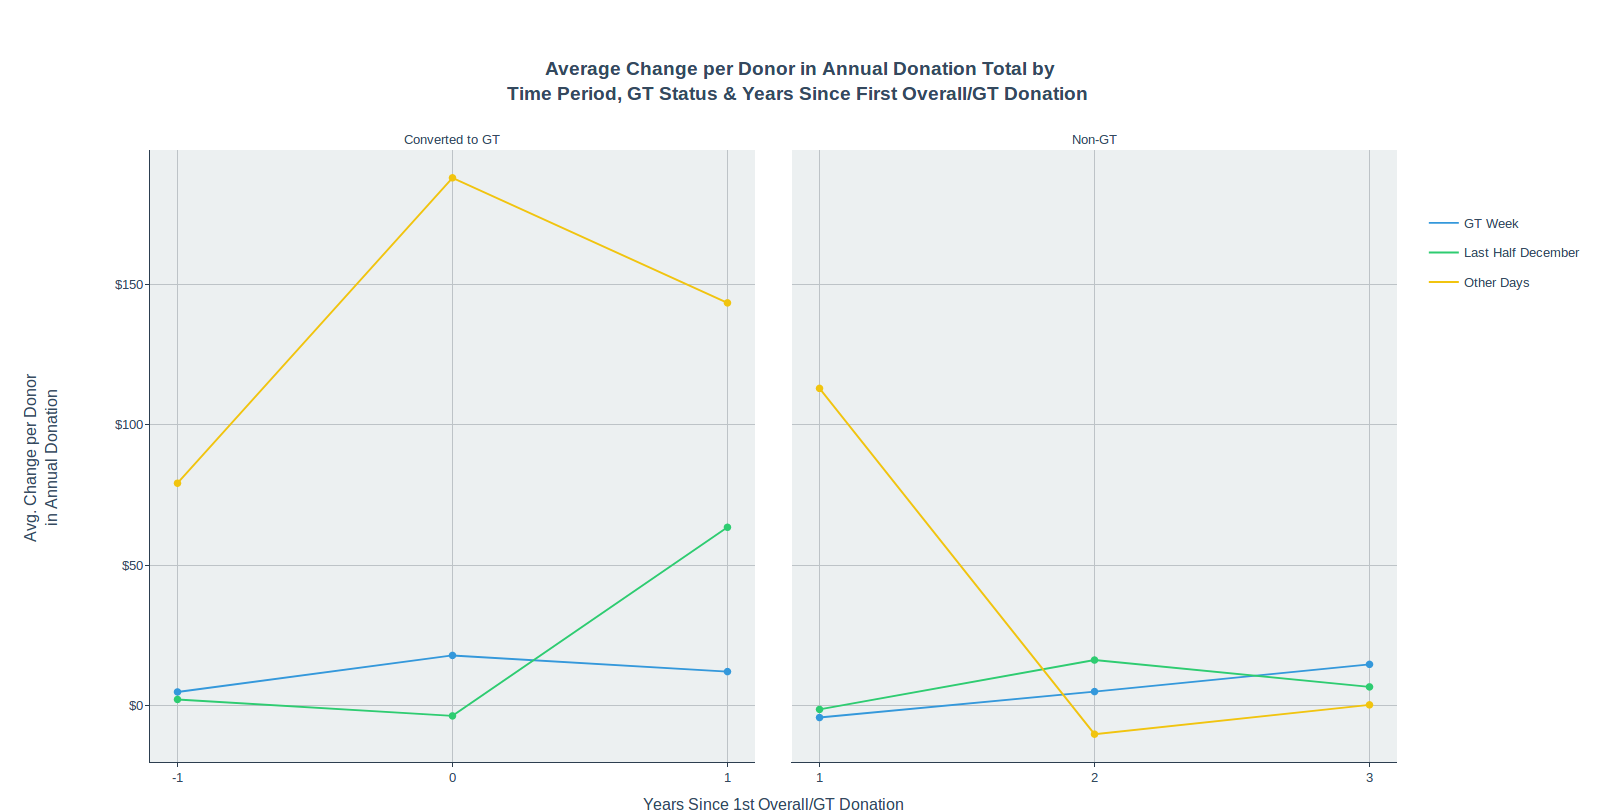
This graph was created with philanthropic transaction data representing 992 charities across 24 years of record keeping. The idea was to compare “GT converts” (those who the charity convinced to give on GivingTuesday, but had not done so before) vs. Non-GT donors on the basis of their average year-over-year change in giving totals to their recipient charities.
The horizontal axis shows years since 1st GivingTuesday donation on the left, and years since 1st overall donation on the right.
Converts, on the year that they converted, increased not only their giving during the week of GivingTuesday, but also during other days as well. Interestingly, the year after their GivingTuesday conversion, they INCREASED their giving during the last half in December.
Non-GT, by contrast, lowered their ‘Other Days’ giving after their first year on file, and increased their last half December giving in the second year.
In sum, this provides evidence that those who convert through GivingTuesday simply give more money overall that year and the one following. They don’t just consolidate the same giving into a specific time frame.


